Transcript
0:00The one-compartment model
Lesson 6.1 of our pharmacokinetic models module: the one-compartment model. A pharmacokinetic model is a set of equations that describes how the drug concentration changes with time. Plasma is the liquid part of the blood. Distribution is the reversible movement of drug between the blood and the tissues. A compartment is a space in which the drug concentration is the same everywhere at a given time. The one-compartment model treats the whole body as one compartment, so it assumes that distribution is instant. The volume of this compartment is the volume of distribution, Vd: the amount of drug in the body divided by the plasma concentration.
0:55Bolus dose and elimination
An intravenous bolus is a single dose injected into a vein over a short time. In the model, the whole dose enters the compartment at time zero. Elimination is the irreversible loss of drug from the body. In first-order elimination, the rate of elimination, the amount removed per unit of time, is proportional to the amount of drug in the body. The elimination rate constant, k, is the rate of elimination divided by the amount. Its unit is 1 per unit of time, such as 1 per hour.
1:38The exponential curve
Under these assumptions, the plasma concentration falls along an exponential curve. The equation is C equals C zero times e to the power of minus k times t. C is the plasma concentration at time t after the bolus, and C zero is its value at time zero. The number e, about 2.718, is the base of the natural logarithm. In each hour, the body thus removes the same fraction of the drug left in the body.
2:16Half-life and clearance
Half-life, the time for the plasma concentration to fall by half, equals 0.693, the natural logarithm of 2, divided by k. Clearance, CL, is the volume of plasma from which the body removes all of the drug per unit of time. In this model, k equals CL divided by Vd.
2:42Initial concentration
Three properties describe this curve: the initial concentration, the exponential decline and the elimination rate constant. The first is the initial concentration. At time zero, the whole dose is in the compartment, so C zero equals the dose divided by Vd. In a study, the fitted curve, extended back to time zero, gives C zero, and Vd is then the dose divided by C zero.
3:16Exponential decline
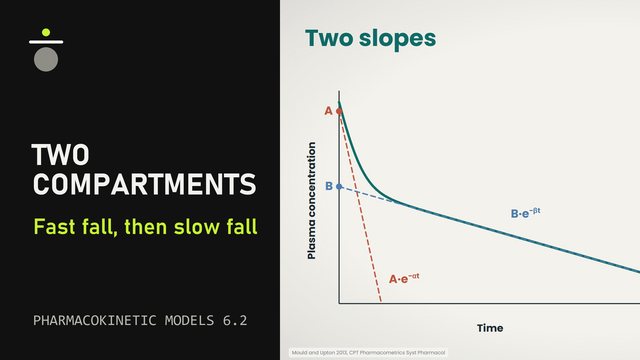
The second is the exponential decline. The concentration falls by the same fraction in each equal interval of time. On a plot with a logarithmic concentration axis, equal distances show equal ratios of concentration. On such a plot, the curve therefore becomes a straight line. When the plot shows two straight segments instead of one, the data usually need a model with more than one compartment.
3:50Elimination rate constant
The third is the elimination rate constant. On a plot of the natural logarithm of C against time, the line has a slope of minus k. Two points on the line give k: the difference between their natural logarithms, divided by the time between them.
4:11Paracetamol after cesarean delivery
Paracetamol, a drug for pain and fever, shows how the model fits measured concentrations. The study recruited 28 women, who received 2 grams of paracetamol into a vein immediately after a cesarean delivery, a birth by surgery. The authors measured paracetamol in plasma at 1, 2, 4 and 6 hours. With a one-compartment model that assumes the dose enters the body at once, the authors calculated each woman's clearance and volume of distribution. At each time, the median is the middle of the women's concentrations when they are put in order. The median concentrations were 22.5, 15.25, 7.9 and 3.9 milligrams per liter.
5:08Paracetamol: k, half-life and volume
On a logarithmic scale, the four medians lie close to one straight line, which agrees with the one-compartment model. The natural logarithms of 22.5 and 3.9 differ by about 1.75. Divided by the 5 hours between these two times, this gives k of about 0.35 per hour. The half-life is then 0.693 divided by 0.35 per hour, about 2.0 hours. On this line, the body removes about 30 percent of the paracetamol left in the body in each hour. The authors also reported a median clearance of 20.3 liters per hour and a median volume of distribution of 58.3 liters. Their ratio, 20.3 liters per hour divided by 58.3 liters, is also about 0.35 per hour. The model gives the initial concentration as the dose, 2,000 milligrams, divided by the median volume of 58.3 liters. This is about 34 milligrams per liter. The line through the first and last medians, extended back to time zero, gives about 32 milligrams per liter. The two values differ by less than 10 percent.
6:46Summary
In summary, the one-compartment model treats the body as one space with instant distribution. In the model, the initial concentration is the dose divided by Vd, about 34 milligrams per liter for paracetamol in these women. With first-order elimination in one compartment, the logarithm of the concentration falls along a straight line. The paracetamol medians lay close to such a line. The slope of that line gives k, which also equals CL divided by Vd: about 0.35 per hour for paracetamol in these women. This concludes lesson 6.1 on the one-compartment model.
Sources
- Mould DR, Upton RN. Basic concepts in population modeling, simulation, and model-based drug development-part 2: introduction to pharmacokinetic modeling methods. CPT Pharmacometrics Syst Pharmacol. 2013. PMID 23887688
- Benet LZ, Sodhi JK. Simplifying pharmacokinetics, applying it to drug and dosage form development, and making drug dosage decisions in clinical medicine: the adaptation of Kirchhoff's laws from physics. AAPS J. 2025. PMID 40603610
- Yim DS, Choi S. Predicting human pharmacokinetics from preclinical data: volume of distribution. Transl Clin Pharmacol. 2020. PMID 33425799
- Toutain PL, Bousquet-Mélou A. Volumes of distribution. J Vet Pharmacol Ther. 2004. PMID 15601439
- Holford N. Pharmacodynamic principles and the time course of immediate drug effects. Transl Clin Pharmacol. 2017. PMID 32095468
- Toutain PL, Bousquet-Mélou A. Plasma terminal half-life. J Vet Pharmacol Ther. 2004. PMID 15601438
- Yim DS. Tutorial for beginners: the concept of clearance explained using the example of a vacuum cleaner. Transl Clin Pharmacol. 2017. PMID 32095451
- Chiou WL, Huang SM, Huang YC. Midpoint back-extrapolation method for the rapid estimation of drugs' volume of distribution and dosage adjustment exhibiting multicompartmental characteristics. Int J Clin Pharmacol Ther Toxicol. 1980. PMID 7364527
- Mazaleuskaya LL, Sangkuhl K, Thorn CF, et al. PharmGKB summary: pathways of acetaminophen metabolism at the therapeutic versus toxic doses. Pharmacogenet Genomics. 2015. PMID 26049587
- Kulo A, van de Velde M, de Hoon J, et al. Pharmacokinetics of a loading dose of intravenous paracetamol post caesarean delivery. Int J Obstet Anesth. 2012. PMID 22341787
Illustrations adapted from Servier Medical Art (smart.servier.com), CC BY 4.0. Structures drawn with RDKit.